AI Data Platform
Self-hosted industrial IoT monitoring platform — six containerized services orchestrated by Docker Compose, with full dev/prod separation and layered security
The Challenge
Build a production-grade industrial IoT monitoring platform with one fundamental rule: total control over the data. No third-party SaaS, no monthly subscription, no vendor lock-in. A sensor publishes a measurement via MQTT and seconds later it's already on a live Grafana dashboard, written to a time-series database, and processed by an analytics service that can fire alerts — all running in containers, anywhere, from a developer laptop to an Ubuntu VPS in the cloud. The second non-negotiable was real separation between development and production. The same docker-compose.yml must run on a dev machine without TLS and with debug ports open, and on the VPS under an overlay that closes everything, enforces TLS on MQTT, and exposes Grafana only behind Nginx with HTTPS Let's Encrypt. Same code, same volume state, different environments — without if/else scattered across config files.
The Architecture
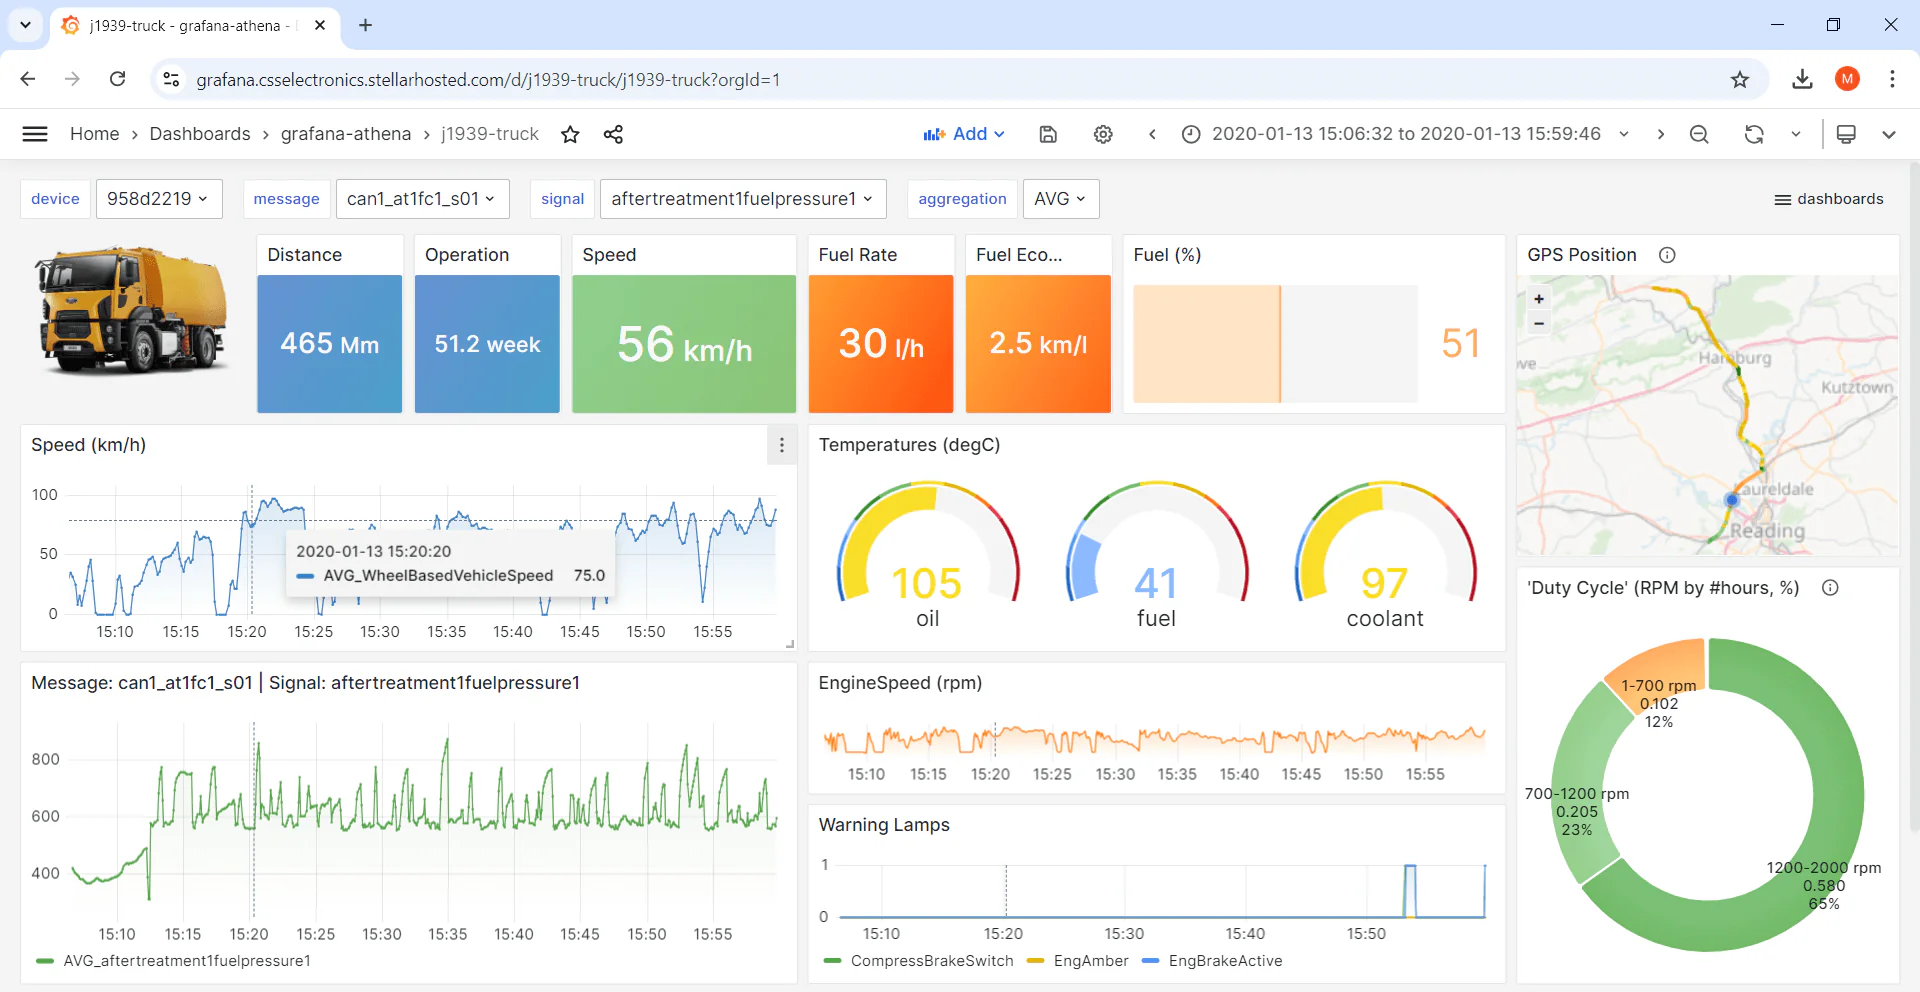
Six services orchestrated by Docker Compose, each in an isolated container, all running as non-root users: • Mosquitto — the entry point. Sensors (ESP32, Raspberry Pi, Node-RED gateways, any MQTT client) publish structured JSON to a hierarchical topic (mov/dados/#). Authentication is mandatory in both environments — never anonymous — with passwords generated by OpenSSL with 256 bits of entropy and hashed inside the container by a custom entrypoint that reads credentials from the .env. • Telegraf — the collector. Subscribes to mov/dados/# and writes each message to InfluxDB using the json_v2 parser configured to extract timestamp, tags (device, location, type, client) and fields (numeric values like temperature, humidity, pressure). A single declarative .conf file — no code, no maintenance. • InfluxDB — the heart. Time-series database optimized for high volumes of sensor data, with Flux queries for efficient temporal aggregation. Self-initializes on first boot via DOCKER_INFLUXDB_INIT_* variables. In production, the database has no exposed port — only reachable through the internal Docker network. • Grafana — the interface. Connects to InfluxDB through a YAML-provisioned datasource, so nothing needs to be created in the UI. Dashboards are .json files in provisioning/dashboards/ loaded automatically with updateIntervalSeconds: 10. • Python Analytics — the analytical brain. A lean script (main.py) running in an infinite loop, reading the latest temperature from InfluxDB every 10 seconds, comparing against a configurable threshold (default 30°C), classifying as Normal or CRITICAL, and writing the insight back to the database. Threshold and interval are parameterized via environment variables. • Backup container — Alpine minimalist, no custom code, mounts grafana_data and influxdb_data read-only, generates daily .tar.gz files with 7-day local retention. The data flow: [IoT Sensors] → [MQTT] → [Mosquitto] → [Telegraf] → [InfluxDB] ↔ [Grafana], with Python Analytics reading from and writing back to InfluxDB, and the backup service spanning Grafana and InfluxDB volumes — feeding both local archives and an optional encrypted remote layer.
Dev / Production Separation
One of the most important architectural decisions of the project. Instead of two parallel codebases or a single compose file polluted with conditionals, the platform uses the base + overlay pattern: docker-compose.yml is the universal base (all services, volumes, healthchecks, networks), and docker-compose.prod.yml is an overlay that applies production restrictions when combined with `docker compose -f docker-compose.yml -f docker-compose.prod.yml up -d`. The overlay does three things: closes Mosquitto ports leaving only 8883 (TLS), removes the direct port exposure of Grafana and InfluxDB (empty {}), and adds an Nginx service that reverse-proxies HTTPS to Grafana using Let's Encrypt certificates mounted from /etc/letsencrypt. In development, a third file (docker-compose.override.yml, generated by the wizard) reopens ports 3000 (Grafana) and 8086 (InfluxDB) locally, without touching the base. The result: the same command (`docker compose up -d`) does different things in different environments, and the developer never has to remember which flag to pass — the right behavior is the default in each place.
Security in Layers
The platform implements protection across six independent layers: • Network — UFW firewall configured by script (setup_firewall.sh) that opens only 22 (SSH), 80, 443 and 8883. Everything else is DROP. In production, ports 1883 and 9001 of Mosquitto don't exist either in the container or in the firewall. • Transport — TLS 1.2+ mandatory on MQTT 8883 and HTTPS 443. The deploy.sh generates self-signed certificates on first run so the stack comes up; later, setup_ssl.sh replaces them with valid Let's Encrypt certs via Certbot standalone. • Authentication — Passwords generated by OpenSSL with 256–512 bits of entropy, stored in .env (chmod 600), and injected into containers as environment variables. Mosquitto receives username and password via a custom entrypoint that runs mosquitto_passwd at boot, overwriting the passwd file to guarantee consistency. • Containers — All services run with explicit non-root UID/GID: Mosquitto 1883:1883, InfluxDB 1000:1000, Grafana 472:472, Telegraf 999:999, Analytics 1000 (created in the Dockerfile). The wizard adjusts permissions on mounted directories before bringing containers up. • Healthchecks — Each service has its own healthcheck with calibrated interval, timeout, retries and start_period. Telegraf depends on Mosquitto and InfluxDB being healthy (condition: service_healthy) before starting. Grafana and Analytics depend on InfluxDB. Healthcheck failure triggers restart: unless-stopped. • Backup — Local layer (daily, 7-day retention) plus optional remote layer (daily, 30-day retention, AES-256 via Rclone crypt). RTO ~30 minutes, RPO ~24 hours.
Setup Wizard & Operations
Most of the operational complexity is hidden behind a single command: `bash scripts/setup_wizard.sh`. The wizard is an interactive Bash script that asks for the environment (Development / Staging / Production), which components to install (each one can be disabled), and Analytics parameters (threshold, interval). Then it does everything: generates the .env with random credentials, creates the directory structure with the right permissions, generates the appropriate docker-compose.override.yml, and triggers deploy.sh automatically. In production, deploy.sh adds an extra phase: it verifies SSL certificates, generates self-signed ones if missing, updates mosquitto.conf to include the 8883 listener with TLS (only if it doesn't already exist — idempotent), and brings up the stack with both compose files. The operational workflow is deliberately git-centric: the developer edits dashboards in local Grafana, exports them with `bash scripts/export_grafana_dashboards.sh` (which serializes each dashboard to JSON in grafana/provisioning/dashboards/), commits, pushes. On the VPS, `git pull` + `bash scripts/update.sh` detects what changed and applies it — restarting only what needs to restart, with no downtime for the rest. The scripts are designed to be defensive: everything checks prerequisites before acting, all destructive commands ask for confirmation, and an existing .env is never overwritten (the wizard only generates if it doesn't exist). Documentation lives in instructions/ numbered 01- through 06- to enforce linear reading: 01 is the index, 02 is local setup, 03 is daily workflow, 04 is VPS deploy, 05 is troubleshooting, 06 is MQTT certificate renewal. Each file is self-contained — the reader goes to a single file and has everything they need for that scenario.
Tech Stack
Entirely based on consolidated open-source tooling, with zero proprietary dependencies: • Broker — Eclipse Mosquitto 2.x with TLS 1.2+, password-hashed authentication and persistent volume. • Collector — Telegraf 1.29 with mqtt_consumer input plugin (json_v2 parser) and influxdb_v2 output plugin. Single config file, zero code. • Database — InfluxDB 2.x with single bucket (mov_dados by default), configurable organization and admin token generated by the wizard. Flux queries for efficient temporal aggregation. • Visualization — Grafana 10.3.3 with datasource and dashboards provisioned via YAML — nothing manually created in the UI persists in Git, because the source of truth is the filesystem. • Analytics — Python 3.12 slim with influxdb-client>=1.36.0. A single dependency, a single file (main.py), graceful shutdown via SIGTERM/SIGINT. • Reverse proxy — Nginx alpine fronting Grafana, with Let's Encrypt via Certbot, security headers (X-Frame-Options, X-Content-Type-Options, HSTS), gzip and WebSocket support for Grafana Live. • Operations — Bash for setup/deploy/update/backup scripts, OpenSSL for credential generation, Certbot for SSL, UFW for firewall, Rclone for encrypted remote backup. • Orchestration — Docker Compose with the base + overlay pattern (docker-compose.yml + docker-compose.prod.yml), named volumes for persistent data, and healthchecks with service_healthy dependencies on every connection. The canonical message format is enforced by the Telegraf parser: clients publish to mov/dados/<device_id> a JSON with three top-level keys — timestamp (ISO 8601 UTC with milliseconds), tags (object with dispositivo, localizacao, tipo, cliente) and fields (object with numeric values).
Backup & Recovery
Data protection is treated as a first-class citizen. A dedicated container (mov_backup, based on Alpine 3.19) mounts grafana_data and influxdb_data read-only and runs a shell script in an infinite loop: generates a timestamped .tar.gz, deletes backups older than 7 days, and sleeps 24 hours. Everything configurable via BACKUP_INTERVAL and RETENTION_DAYS. The remote layer is optional and configured by a separate wizard (setup_remote_backup.sh) that installs Rclone, offers Google Drive (15 GB), MEGA (20 GB), OneDrive (5 GB) or Dropbox (2 GB), and asks whether to enable encryption (AES-256 via Rclone crypt — without the password, the remote files are useless). The encryption password lives in .env as BACKUP_CRYPT_PASSWORD with 256 bits of entropy. Restore is manual and documented: stop containers, extract the .tar.gz into grafana/data/ and influxdb/data/, fix permissions (chown -R 472:472 and chown -R 1000:1000), and bring everything back up. RTO ~30 minutes.
Results
A self-hosted industrial IoT monitoring stack that gives operators the same visual and analytical power offered by commercial IoT SaaS platforms (typically $50–200/month) — but with full data sovereignty, no recurring fees, and a setup time of around 10 minutes through the interactive wizard. LGPD/GDPR friendly by design: nothing leaves the operator's server unless explicitly opted in. The platform is in production and operational. Some pieces are still evolving: the Analytics service currently monitors only temperature (the architecture allows adding new rules easily, but they're not yet written), the HTTPS block in Nginx default.conf still has to be manually uncommented after setup_ssl.sh runs (a future iteration of the script will automate this), and the remote backup, while functional, still lacks automated restore tests — only manual validation.